NumPy i0()
The numpy.i0() function computes the modified Bessel function of the first kind, order 0, for each element in the input array.
Syntax
</>
Copy
numpy.i0(x)Parameters
| Parameter | Type | Description |
|---|---|---|
x | array_like of float | Input values for which the modified Bessel function is computed. |
Return Value
| Return | Type | Description |
|---|---|---|
out | ndarray | An array containing the computed modified Bessel function values. |
Examples
1. Computing the Bessel Function for a Single Value
Here, we compute the modified Bessel function of the first kind, order 0, for a single value.
</>
Copy
import numpy as np

# Define a single input value
x = 2.0

# Compute the modified Bessel function
result = np.i0(x)

# Print the result
print("Modified Bessel function of order 0 at x=2.0:", result)
Output:
Modified Bessel function of order 0 at x=2.0: 2.279585302336067
2. Computing the Bessel Function for an Array of Values
We compute the modified Bessel function for multiple values in an array.
</>
Copy
import numpy as np

# Define an array of input values
x_values = np.array([0, 1, 2, 3, 4, 5])

# Compute the modified Bessel function for each value
bessel_values = np.i0(x_values)

# Print the results
print("Input values:", x_values)
print("Modified Bessel function values:", bessel_values)
Output:
Input values: [0 1 2 3 4 5]
Modified Bessel function values: [ 1.          1.26606588  2.2795853   4.88079259 11.30192195 27.23987182]
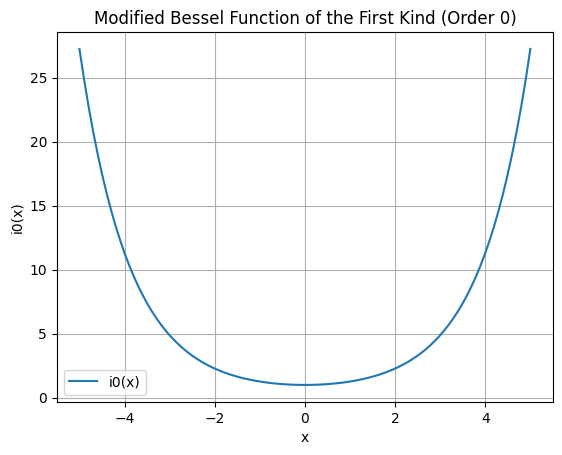
3. Plotting the Modified Bessel Function
We visualize the modified Bessel function over a range of values.
</>
Copy
import numpy as np
import matplotlib.pyplot as plt

# Generate values from -5 to 5
x_values = np.linspace(-5, 5, 100)

# Compute the modified Bessel function
bessel_values = np.i0(x_values)

# Plot the function
plt.plot(x_values, bessel_values, label='i0(x)')
plt.xlabel("x")
plt.ylabel("i0(x)")
plt.title("Modified Bessel Function of the First Kind (Order 0)")
plt.legend()
plt.grid(True)
plt.show()
Output:
The output will be a graph of the modified Bessel function i0(x) over the range [-5, 5].