 TutorialKart.com
Creating SAS Reports with List Data, PROC PRINT, PROC REPORT, and ODS
In this SAS tutorial, you will learn how to create SAS reports from a data set. The tutorial first uses the List Data task in SAS Studio to build a simple listing and then introduces the SAS procedures commonly used for detail, grouped, and summary reports.
A SAS report normally has two parts. A reporting procedure determines which observations, columns, groups, and statistics appear. The Output Delivery System (ODS) determines how the report is delivered, such as HTML, PDF, RTF, PowerPoint, or an Excel workbook. The destinations available to you can depend on the SAS product and version installed.
SAS Reporting Methods and Their Uses
| SAS reporting method | Suitable use |
|---|---|
| List Data task | Create a listing through the SAS Studio interface and generate the corresponding SAS code. |
PROC PRINT | Display selected observations and variables in a straightforward detail report. |
PROC REPORT | Create formatted detail and summary reports with grouping, ordering, computed columns, and statistics. |
PROC TABULATE | Build multidimensional summary tables containing counts and descriptive statistics. |
| ODS | Send procedure output to supported destinations such as HTML, PDF, RTF, PowerPoint, or Excel. |
SAS reports can also be described by their content. A detail report lists individual observations, a summary report aggregates values by category, and a multi-section report presents separate results for groups or combines several output objects in one destination.
Creating a SAS Listing with the List Data Task
This example uses the built-in SASHELP.CARS data set. It contains variables describing vehicles, including model, type, origin, drivetrain, suggested retail price, invoice price, engine size, cylinders, horsepower, weight, wheelbase, and length.
Opening the List Data Task in SAS Studio
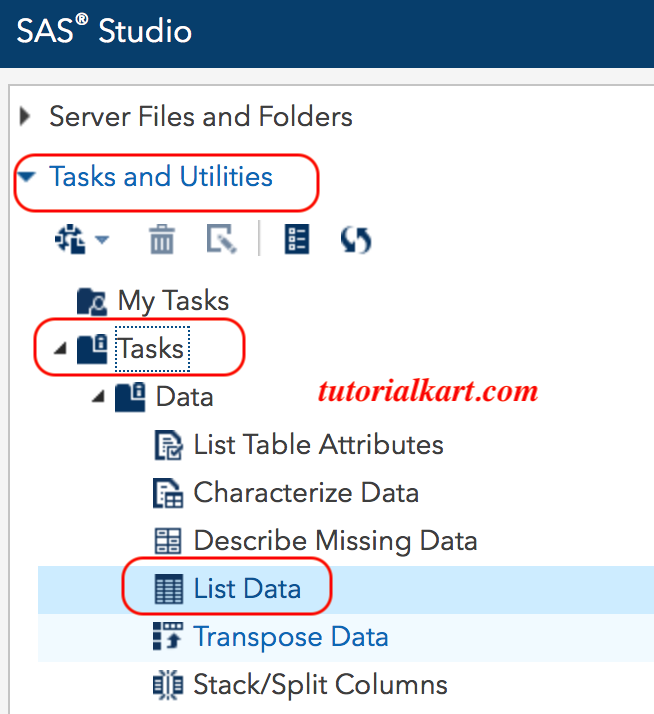
- Open the Tasks and Utilities pane.
- Navigate to Tasks | Data | List Data.
- Double-click List Data to open its settings.
The exact labels and location of the task can vary between SAS Studio releases, but the task settings provide controls for selecting a table, assigning variables, limiting rows, and changing the appearance of the listing.
Selecting the SASHELP.CARS Data Set
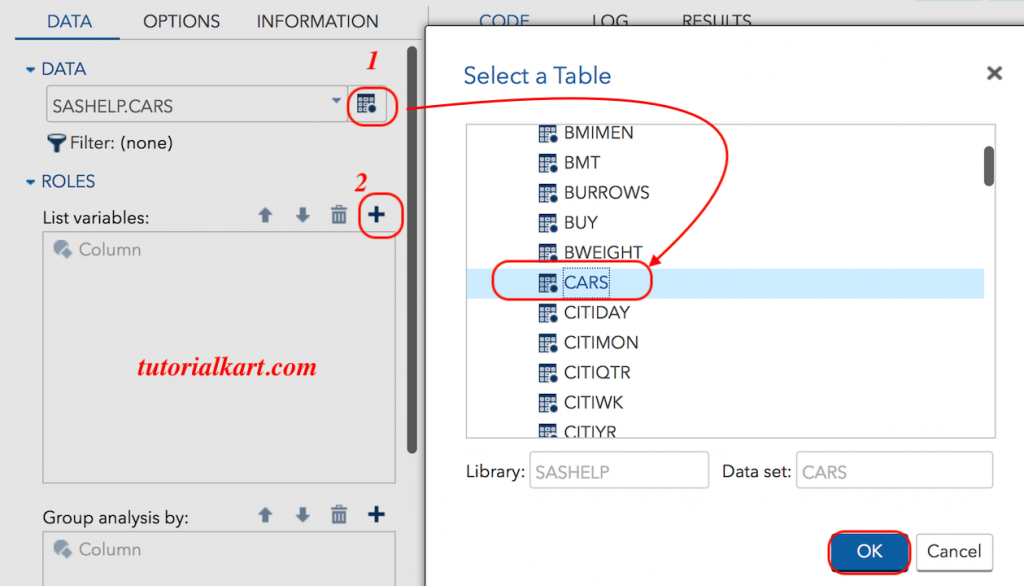
Open the List Data task and use the data-selection control near the upper-right area of the task settings. Choose the SASHELP library, select the CARS data set, and confirm the selection.
Adding Variables to the SAS Cars Listing
Use the plus sign (+) in the variable-selection area to add columns to the report. For this listing, select Model, Type, Origin, EngineSize, Horsepower, Weight, and Invoice. The order in which the variables are assigned determines their left-to-right order in the resulting table.
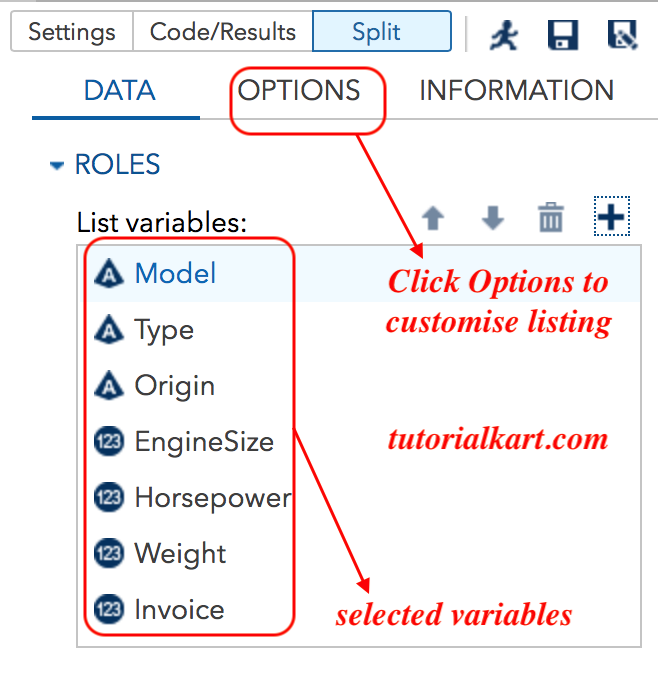
Confirm the variable selection to return to the task settings.
Limiting Rows and Formatting the SAS Listing
The List Data task can control the number of rows displayed, observation numbers, column headings, label splitting, heading direction, and column width. These settings affect the presentation of the report without changing the source data set.
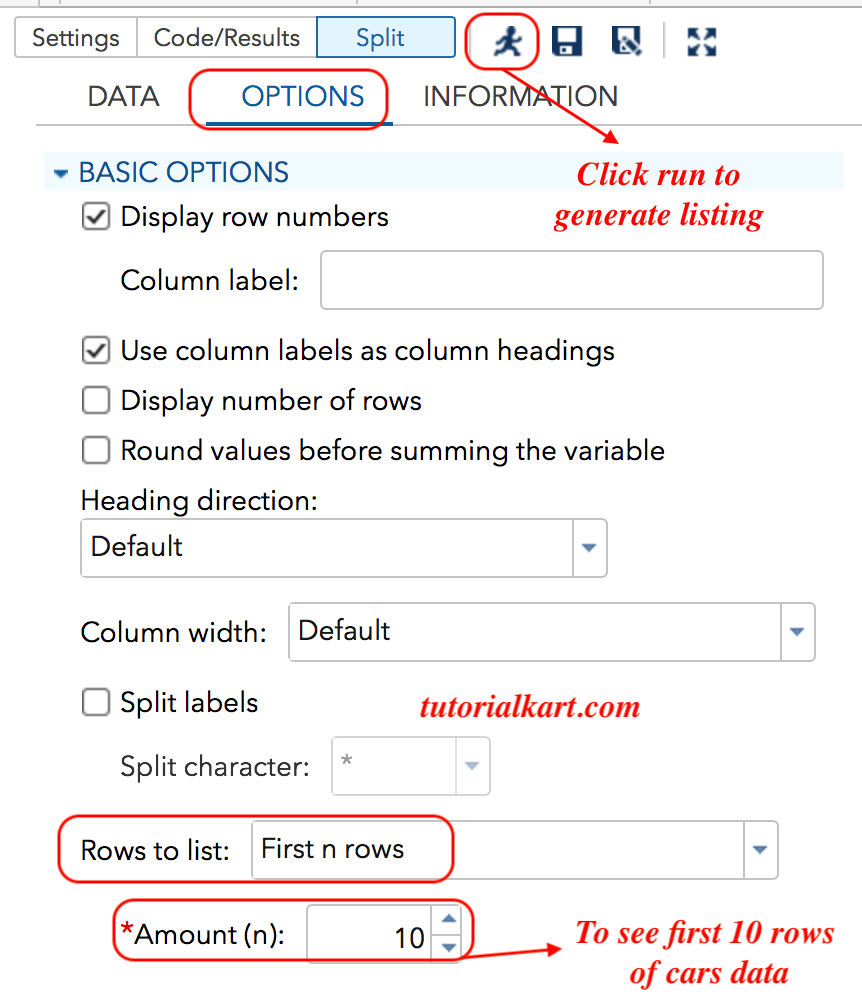
Clear the Display row number option if the report should not include the Obs column. Select Column labels as column headings, choose the option for listing the first n rows, and set the row count to 10.
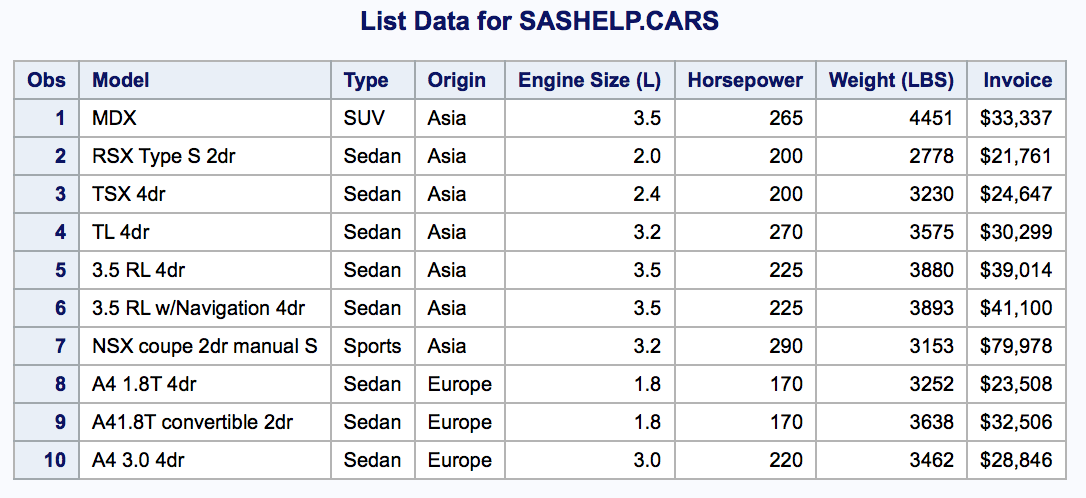
Click the Run icon. SAS Studio generates and submits code that uses PROC PRINT to display the first 10 observations from SASHELP.CARS.
SAS Studio Code Generated by the List Data Task
/*
 *
 * Task code generated by SAS Studio 3.71
 *
 * Generated on '7/3/18, 4:39 PM'
 * Generated by 'sasdemo'
 * Generated on server 'LOCALHOST'
 * Generated on SAS platform 'Linux LIN X64 2.6.32-696.20.1.el6.x86_64'
 * Generated on SAS version '9.04.01M5P09132017'
 * Generated on browser 'Mozilla/5.0 (Macintosh; Intel Mac OS X 10_13_5) AppleWebKit/605.1.15 (KHTML, like Gecko) Version/11.1.1 Safari/605.1.15'
 * Generated on web client 'http://localhost:10080/SASStudio/371/main?locale=en_US&zone=GMT%252B05%253A30&http%3A%2F%2Flocalhost%3A10080%2FSASStudio%2F371%2Findex='
 *
 */

title1 "List Data for SASHELP.CARS";

proc print data=SASHELP.CARS
    (obs=10) label round;
    var Model Type Origin EngineSize Horsepower Weight Invoice;
run;

title1;
In this program, the OBS=10 data set option limits processing to the first 10 observations. The LABEL option tells PROC PRINT to use variable labels as headings when labels are available, while ROUND rounds values before displaying them. The VAR statement controls which variables appear and their order.
SAS List Data Report Result
The generated report contains the selected variables for the first 10 observations in SASHELP.CARS. Because the row-number option was cleared, the listing does not display the default Obs column.
Creating Formatted SAS Reports with PROC REPORT
PROC REPORT is suitable when a report needs grouping, ordering, statistics, custom headings, or computed columns. Each variable listed in the COLUMN statement can be assigned a role through a DEFINE statement.
title "Average Invoice by Vehicle Origin";

proc report data=sashelp.cars nowd;
    column Origin Invoice;
    define Origin / group "Vehicle Origin";
    define Invoice / analysis mean format=dollar12.2
                     "Average Invoice";
run;

title;
The GROUP role creates one report group for each distinct value of Origin. The ANALYSIS MEAN definition calculates the average invoice value within each group, and the DOLLAR12.2 format displays that result as currency.
Creating Summary Tables with PROC TABULATE
PROC TABULATE creates summary tables by combining classification variables with analysis variables and statistics. The following report displays the number of cars and the mean suggested retail price for each vehicle origin.
title "Vehicle Count and Average MSRP by Origin";

proc tabulate data=sashelp.cars;
    class Origin;
    var MSRP;
    table Origin,
          n="Number of Cars" MSRP*mean="Average MSRP";
    format MSRP dollar12.2;
run;

title;
The CLASS statement identifies Origin as a categorical variable. The VAR statement identifies MSRP as an analysis variable, and the TABLE statement defines the rows, columns, and statistics in the report.
Exporting SAS Reports with ODS
ODS destinations surround the reporting procedure that produces the output. Open the required destination before the procedure runs and close it afterward so SAS completes the output file correctly.
Writing a SAS Report to a PDF File
ods pdf file="cars-report.pdf";

title "Cars from SASHELP.CARS";
proc print data=sashelp.cars(obs=10) label;
    var Model Type Origin Horsepower Invoice;
run;
title;

ods pdf close;
The file path must be writable by the SAS session. In a server-based environment, the path refers to a location accessible to the SAS server rather than necessarily to a folder on the local computer.
Writing a SAS Report to an Excel Workbook
ods excel file="cars-report.xlsx"
          options(sheet_name="Cars");

proc report data=sashelp.cars nowd;
    column Make Model Type Origin Invoice;
    define Make / display;
    define Model / display;
    define Type / display;
    define Origin / display;
    define Invoice / display format=dollar12.2;
run;

ods excel close;
If an ODS destination is unavailable in a particular SAS installation, check the product version and licensed components before changing the report procedure itself.
Filtering, Sorting, and Grouping SAS Report Data
Reports often need a subset of the source observations. A WHERE statement filters rows during procedure processing. Sorting can be performed with PROC SORT, while PROC REPORT can arrange report rows through variables defined with the ORDER or GROUP role.
proc print data=sashelp.cars label;
    where Origin = "Asia" and Horsepower >= 200;
    var Make Model Type Horsepower Invoice;
    format Invoice dollar12.2;
run;
This report does not modify SASHELP.CARS. It displays only observations that satisfy both conditions and formats the invoice value for presentation.
Common SAS Report-Writing Problems
- No observations appear: Check the
WHEREcondition and confirm that the comparison values match the stored data. - A variable is not found: Verify the data set name and variable names with the table metadata or a procedure such as
PROC CONTENTS. - Rows are duplicated unexpectedly: Inspect the source data and any joins used to prepare the reporting table.
- Summary values are incorrect: Confirm the roles assigned to variables in
PROC REPORTand the dimensions defined inPROC TABULATE. - An output file is missing: Confirm that the ODS destination was closed and that the SAS session can write to the specified path.
- Column headings are unclear: Apply meaningful variable labels, formats, or report-specific headings without changing the underlying values.
SAS Report Editorial QA Checklist
- Confirm that every report names the intended SAS library and data set.
- Verify that selected variables exist and appear in the required column order.
- Check filters against the actual data values and character case.
- Recalculate grouped totals, counts, and averages from a small sample before publishing the report.
- Apply SAS formats appropriate to currency, dates, percentages, and decimal values.
- Open generated PDF, RTF, HTML, or Excel output and inspect headings, wrapping, page breaks, and missing values.
- Close each opened ODS destination after the final reporting procedure.
Frequently Asked Questions About Creating SAS Reports
Which SAS procedure should I use for a basic detail report?
Use PROC PRINT when you need a straightforward listing of observations and selected variables. The SAS Studio List Data task can generate PROC PRINT code through a graphical interface.
When should PROC REPORT be used instead of PROC PRINT?
Use PROC REPORT when the output requires grouped rows, ordered categories, summary statistics, computed columns, breaks, or more control over report headings and formatting.
What is the difference between PROC REPORT and PROC TABULATE?
PROC REPORT supports detailed listings and customized report layouts. PROC TABULATE is oriented toward multidimensional summary tables in which classification variables and statistics intersect across rows and columns.
How do I save a SAS report as PDF or Excel?
Open the appropriate ODS destination, run the reporting procedure, and then close the destination. Use ODS PDF for a PDF file or ODS EXCEL for an Excel workbook when those destinations are supported by the SAS installation.
Does creating a SAS report change the source data set?
Reporting procedures such as PROC PRINT, PROC REPORT, and PROC TABULATE read the source data and produce output; they do not normally change the source data set. Separate DATA steps or procedures that write data are required to create or replace a data set.