Matplotlib PyPlot – Set Transparency for Bar Plot
To set transparency for bars in a Bar Plot using Matplotlib PyPlot API, call matplotlib.pyplot.bar() function, and pass required alpha value to alpha parameter of bar() function.
The definition of matplotlib.pyplot.bar() function with alpha parameter is
</>
Copy
bar(x, height, alpha=None)Of course, there are other named parameters, but for simplicity, only alpha parameter is given along with required x and height.
where
| Parameter | Description |
|---|---|
| alpha | The transparency of bars in the bar plot. The parameter takes a scalar or None. |
Example
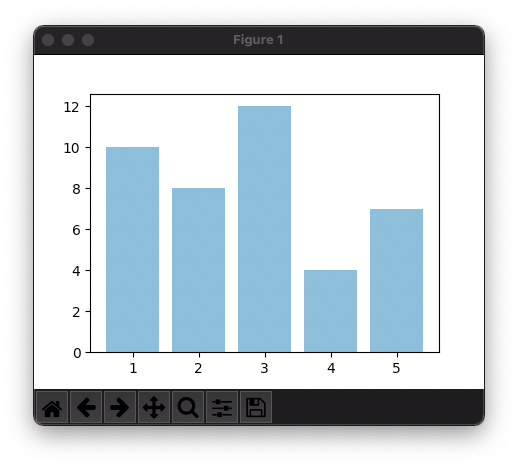
In the following program, we will draw a bar plot with bars 50% transparency, which translates to an alpha of 0.5.
example.py
</>
Copy
import matplotlib.pyplot as plt

#data
x = [1, 2, 3, 4, 5]
h = [10, 8, 12, 4, 7]

#bar plot
plt.bar(x, height=h, alpha=0.5)

plt.show()
Output
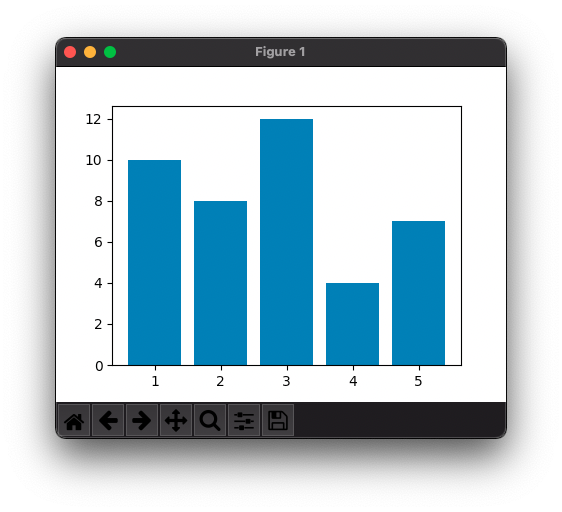
Now, let us try with an alpha of 1.0, which is also the default value using which the bar plot is drawn.
example.py
</>
Copy
import matplotlib.pyplot as plt

#data
x = [1, 2, 3, 4, 5]
h = [10, 8, 12, 4, 7]

#bar plot
plt.bar(x, height=h, alpha=1.0)

plt.show()
Output
Conclusion
In this Matplotlib Tutorial, we learned how to set line width for bars in bar plot using Matplotlib PyPlot API.