Matplotlib – Stacked Bar Plot
To draw a Stacked Bar Plot using Matplotlib, call matplotlib.pyplot.bar() function, and pass required values (X-axis, and bar heights) for the first bar plot. For the second bars, call the same bar() function and pass the first bar data as value for parameter bottom.
The syntax to draw a stacked bar plot (with two bar plots: bar_heights_1, bar_heights_2) is
plt.bar(labels, bar_heights_1, width, label='First Set of Bars')
plt.bar(labels, bar_heights_2, width, bottom= bar_heights_1, label='Second Set of Bars')
If an new set of bars are to be drawn on the above two bars, then the bottom of this third bar has to be set to the addition of the previous two bars. We can use list comprehension for this operation.
Examples
Stacked Bar Plot – 2 Sets of Bars
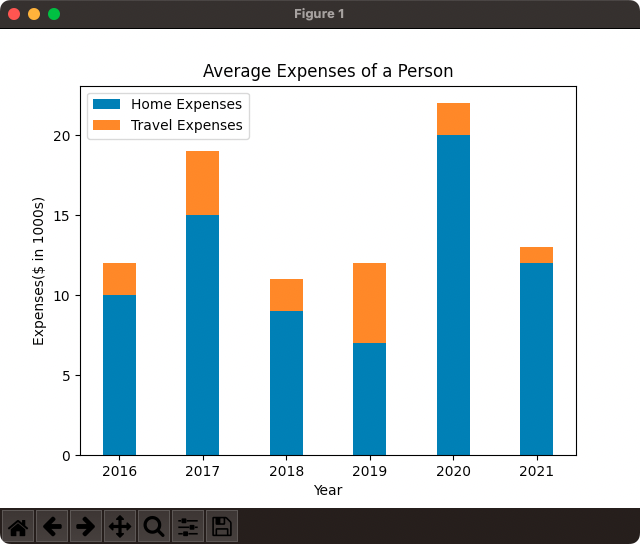
In the following program, we will take home, and travel expenditure data (two bars, one for each data) for different years and draw them using stacked bar plot.
example.py
import matplotlib.pyplot as plt

#data
#x-axis
years = [2016, 2017, 2018, 2019, 2020, 2021]
#y-axis
home_expenses = [10, 15, 9, 7, 20, 12]
travel_expenses = [2, 4, 2, 5, 2, 1]

#bar plot properties
width = 0.4

#draw stacked bar plot
plt.bar(years, home_expenses, width, label='Home Expenses')
plt.bar(years, travel_expenses, width, bottom=home_expenses, label='Travel Expenses')
plt.xlabel('Year')
plt.ylabel('Expenses($ in 1000s)')
plt.title('Average Expenses of a Person')
plt.legend()

#show plot as image
plt.show()
Output

Stacked Bar Plot – 3 Sets of Bars
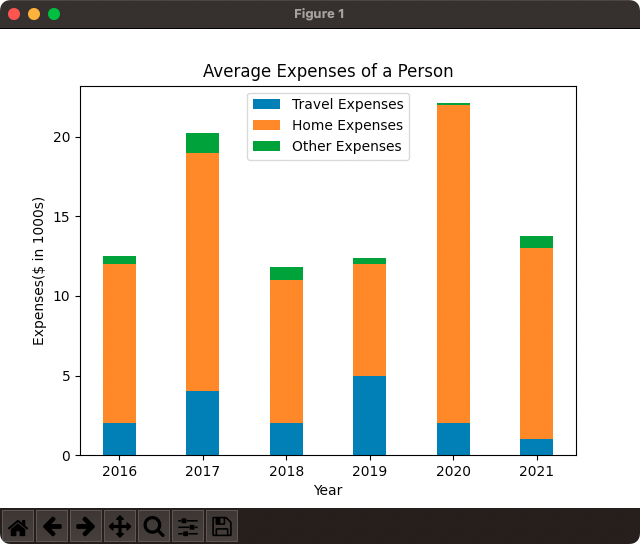
In the following program, we will take home, travel, and other expenditure data (three bars, one for each data) for different years and draw them using stacked bar plot.
example.py
import matplotlib.pyplot as plt

#data
#x-axis
years = [2016, 2017, 2018, 2019, 2020, 2021]
#y-axis
home_expenses = [10, 15, 9, 7, 20, 12]
travel_expenses = [2, 4, 2, 5, 2, 1]
other_expenses = [0.5, 1.2, 0.8, 0.4, 0.1, 0.75]

#bar plot properties
width = 0.4

#draw stacked bar plot
plt.bar(years, travel_expenses, width, label='Travel Expenses')
plt.bar(years, home_expenses, width, bottom=travel_expenses, label='Home Expenses')
plt.bar(years, other_expenses, width, bottom=[home_expenses[i] + travel_expenses[i] for i in range(len(home_expenses))], label='Other Expenses')

plt.xlabel('Year')
plt.ylabel('Expenses($ in 1000s)')
plt.title('Average Expenses of a Person')
plt.legend()

#show plot as image
plt.show()
Output

Conclusion
In this Matplotlib Tutorial, we learned how to draw a stacked bar plot using Matplotlib PyPlot API.
