Matplotlib – Set Line Style for Step Plot
To set specific line style: solid, dashed, dash-dot, dotted, etc., for Step Plot in Matplotlib, call matplotlib.pyplot.step() function, and pass required line-style value for lifestyle parameter of step() function.
The definition of matplotlib.pyplot.step() function with color parameter is
step(x, y, linestyle='dashed')Of course, there are other named parameters, but for simplicity, only color parameter is given along with required x and height.
where linestyle takes a string value from any of the following values.
| Value | Description |
|---|---|
'-' or 'solid' | Solid line. |
'--' or 'dashed' | Dashed line. |
'-.' or 'dashdot' | Dash-dotted line. |
':' or 'dotted' | Dotted line. |
'none', 'None', ' ', or '' | Draw nothing for a line. |
Example
Solid Line
In the following program, we will draw a Step Plot with a solid line. This is the default line style for a Step Plot.
linestyle='solid'
example.py
import matplotlib.pyplot as plt

# make data
x = [0, 1, 2, 3, 4, 5, 6, 7, 8]
y = [3, 4, 8, 2, 6, 5, 9, 4, 2]

#draw step plot
plt.step(x, y, linestyle='solid')

#show plot as image
plt.show()
Output

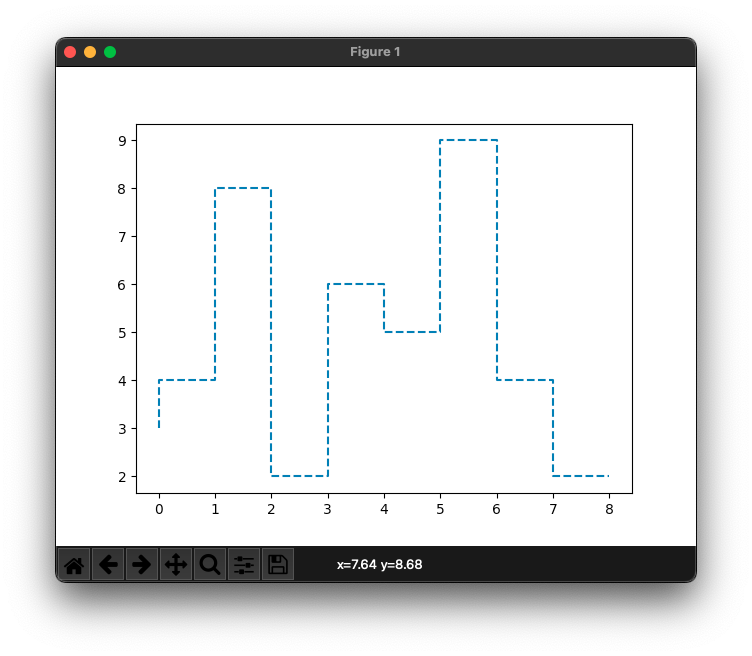
Dashed Line
In the following program, we will draw a Step Plot with a dash styled line.
linestyle='dashed'
example.py
import matplotlib.pyplot as plt

# make data
x = [0, 1, 2, 3, 4, 5, 6, 7, 8]
y = [3, 4, 8, 2, 6, 5, 9, 4, 2]

#draw step plot
plt.step(x, y, linestyle='dashed')

#show plot as image
plt.show()
Output
Dash-dot Line
In the following program, we will draw a Step Plot with a dash-dot styled line.
linestyle='dashdot'
example.py
import matplotlib.pyplot as plt

# make data
x = [0, 1, 2, 3, 4, 5, 6, 7, 8]
y = [3, 4, 8, 2, 6, 5, 9, 4, 2]

#draw step plot
plt.step(x, y, linestyle='dashdot')

#show plot as image
plt.show()
Output

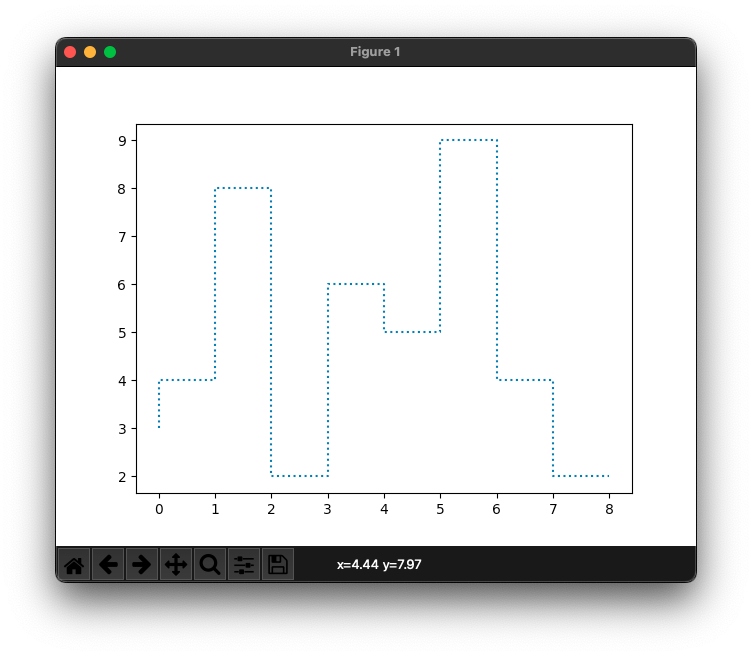
Dotted Line
In the following program, we will draw a Step Plot with a dot styled line.
linestyle='dotted'
example.py
import matplotlib.pyplot as plt

# make data
x = [0, 1, 2, 3, 4, 5, 6, 7, 8]
y = [3, 4, 8, 2, 6, 5, 9, 4, 2]

#draw step plot
plt.step(x, y, linestyle='dotted')

#show plot as image
plt.show()
Output
Conclusion
In this Matplotlib Tutorial, we learned how to set line style for Step Plot using Matplotlib PyPlot API.