R – Plot Line Thickness
To set plot line width/thickness in R, call plot() function and along with the data to be plot, pass required thickness/line-width value for the “lwd” parameter.
In this tutorial, we will learn how to set plot line width, with example programs.
Syntax
The syntax to draw a plot with twice the default thickness using plot() function is
plot(x, y, lwd=2.0)Examples
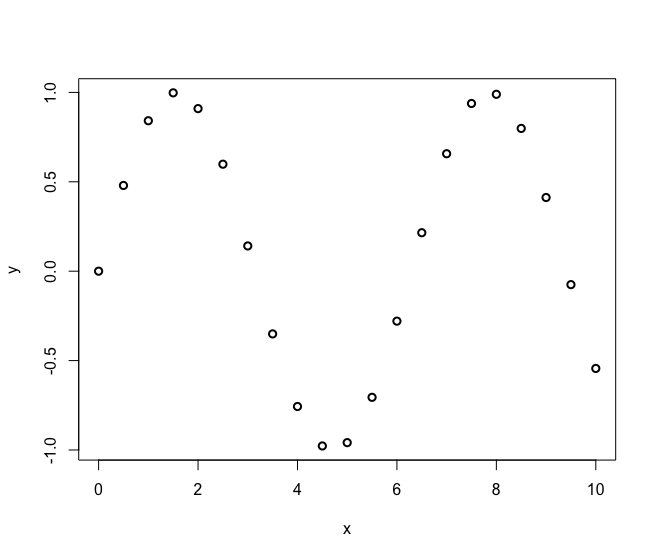
In the following program, we will take two vectors in x and y, and plot Y vs X, using plot() function with the line width set to 2.0.
example.R
x <- seq(0, 10, 0.5)
y <- sin(x)
plot(x, y, lwd=2.0)
Output
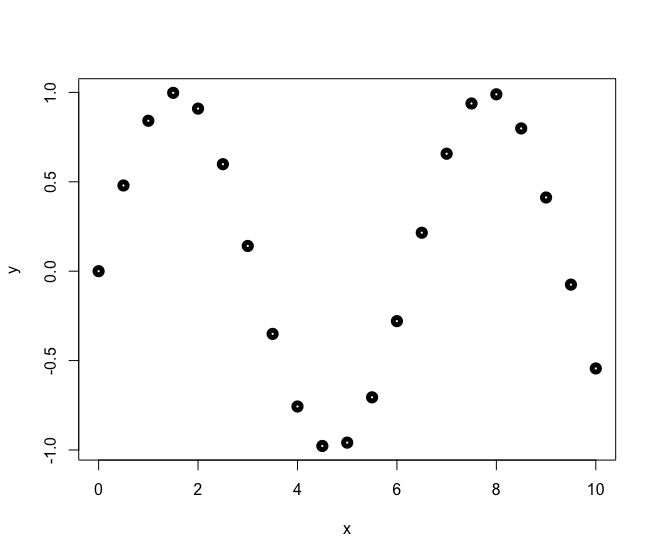
Now, let us increase the line width to 5.0 and observe the output plot.
example.R
x <- seq(0, 10, 0.5)
y <- sin(x)
plot(x, y, lwd=5.0)
Output
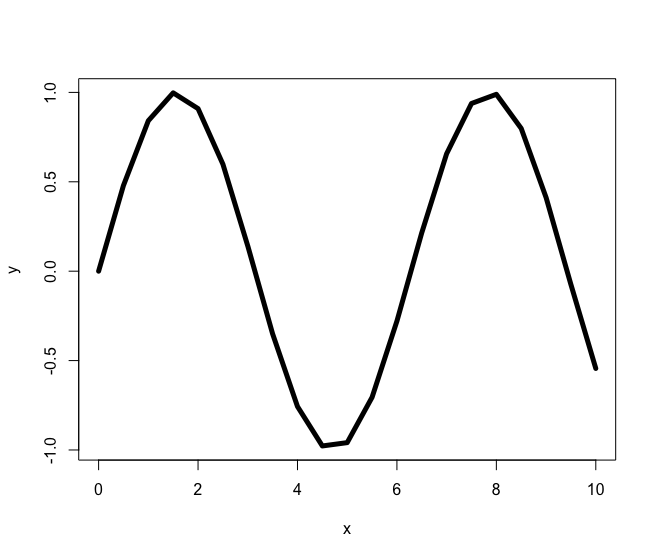
In the following program, we will draw a line plot and set the plot’s line width to 5.0.
example.R
x <- seq(0, 10, 0.5)
y <- sin(x)
plot(x, y, type="l", lwd=5.0)
Output
Conclusion
In this R Tutorial, we learned how to set plot line width/thickness via plot() function, with the help of example program.