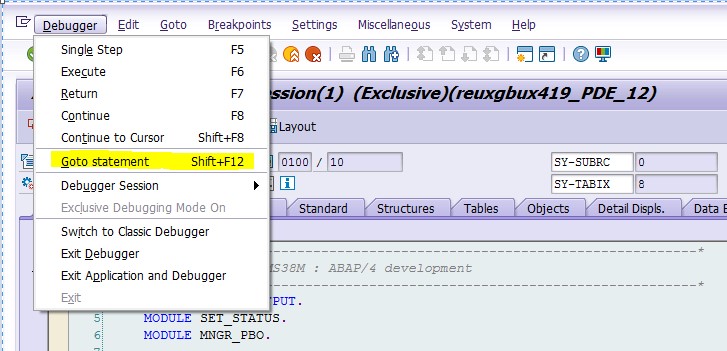
Debugging in SAP ABAP refers to the process of analyzing a program’s flow and identifying errors or unexpected behavior during execution. By pausing the program at specific points, developers can observe how variables change and how logic executes step by step. This approach is essential for:
- Enhancing program efficiency and correctness.
- Validating program functionality.
- Identifying and fixing runtime errors.
1. Introduction to SAP ABAP Debugger
The ABAP Debugger is a tool designed to facilitate detailed analysis of programs by allowing developers to run them line by line. It provides insights into the flow logic and runtime values of variables, helping developers pinpoint errors or unexpected behavior.
- Classic ABAP Debugger:
This is the legacy tool, primarily suited for older SAP systems. It has limited features but remains functional for traditional use cases. - New ABAP Debugger:
Equipped with a modern interface and advanced tools, the new debugger supports complex debugging tasks, including dynamic breakpoints, watchpoints, and more.
2. Getting Started with Debugging
1. Set Breakpoints and Run the Program
Breakpoints are predefined pauses in the code, allowing developers to check runtime data and the flow of execution.
2. Run the Program in Debugging Mode
This method is ideal for analyzing a program from the start. It is especially useful when you are unfamiliar with the code, as it provides insights into every step of execution.
3. Setting Breakpoints
Breakpoints are indispensable tools for debugging. They temporarily halt program execution, enabling developers to inspect variable values and logic.
Static Breakpoints
- These are hardcoded into the program using the
BREAK-POINTstatement. - Use them during development to halt execution at a specific line.
- Ideal when multiple developers are working on the same program and need to analyze the same line.
Example:
PROGRAM RSDEBUG_01.

IF SY-SUBRC <> 0.
  BREAK-POINT.
ENDIF.
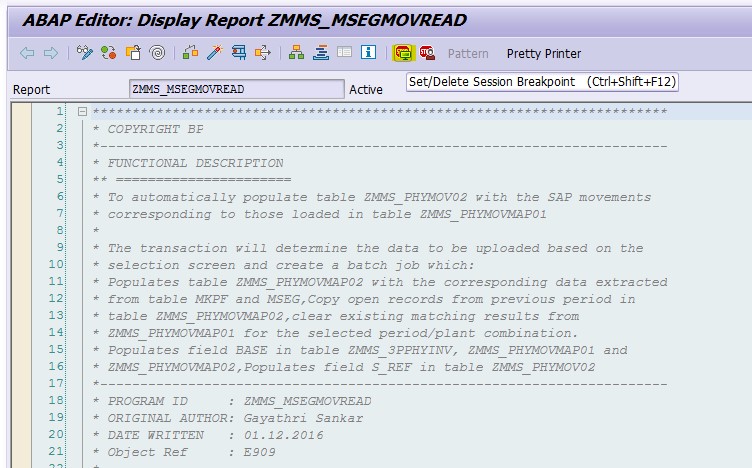
Dynamic Breakpoints
- Set dynamically during runtime and user-specific.
- They do not require changes to the program code and can be deleted or modified easily.
- Can include counters to activate after a specific number of occurrences.
- A maximum of 30 dynamic breakpoints can be active at a time.
Image Example:
External Breakpoints
External breakpoints are used when debugging web-based applications like BSP or Web Dynpro. They allow debugging outside of SAP GUI (e.g., in a browser). These breakpoints remain valid for up to 2 hours.
Image Example:
4. Debugging Keys
Efficient navigation in the debugger is crucial. Here are the key functions:
| Key | Description |
|---|---|
| F5 | Executes the program line by line. |
| F6 | Skips over subroutines or function modules without stepping into them. |
| F7 | Exits the current subroutine or function module and returns to the caller. |
| F8 | Continues execution until the next breakpoint or program completion. |
These keys provide control over the level of detail analyzed during debugging.
5. Using Watchpoints
Watchpoints provide a way to monitor variables during runtime. They interrupt program execution when a specific condition or value change is detected.
Key features:
- Monitor up to 5 variables in a program.
- Specify conditions for activation, such as a field value reaching a threshold.
- User-specific and do not affect other users running the same program.
Image Examples:
6. Processing Fields
Fields can be dynamically modified during debugging to test alternate scenarios or correct errors without altering the code. For example:
- Change a variable’s value and observe how it affects subsequent logic.
- Ensure a field contains a valid value to prevent unexpected program behavior.
Constants declared in the code, however, cannot be modified.
Image Example:
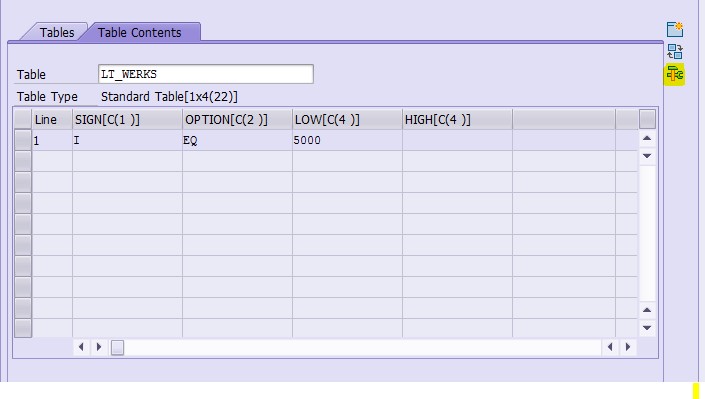
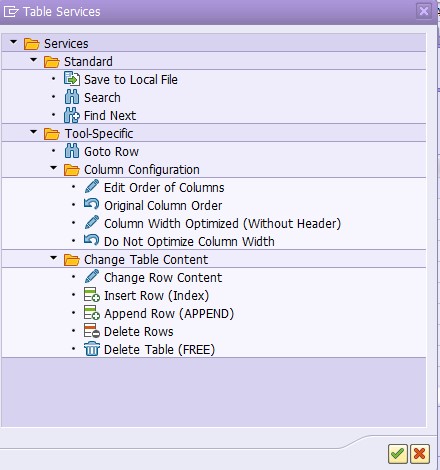
7. Debugging Internal Tables
Internal tables are often at the heart of ABAP programs, and analyzing them during debugging is critical. Debugging internal tables allows:
- Inspecting data row by row.
- Modifying specific entries during runtime to test program behavior with different data sets.
Image Examples:
8. Advanced Debugging Techniques
Pop-Up Debugger
Sometimes, modal windows or screens lack command lines to activate debugging. In such cases, you can use a .bat file to enable debugging by dragging it onto the modal window.
9. Debugging Variants
Debugger variants simplify repetitive debugging tasks by saving current settings, such as breakpoints and UI configurations.
Key Features:
- Reuse settings across sessions.
- Share variants with team members to ensure consistent debugging setups.
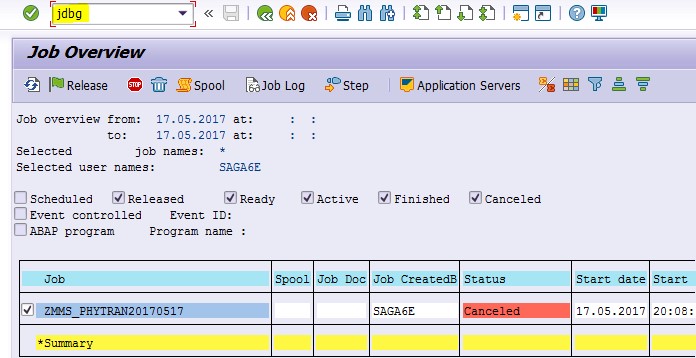
10. Debugging Background Jobs
Scheduled/Released Jobs
- Use SM37 to select the job.
- Enter
JDBGin the command line to enable debugging for that job.
Active Jobs
- Use SM50 to find the relevant process.
- Activate debugging from the Program/Mode → Debugging option.
Image Example:
11. Debugging Scripts and Smart Forms
Scripts
- Execute the RSTXDBUG report to activate script debugging.
- Open the script in SE71 and enable debugging from the utilities menu.
Smart Forms
Insert a static breakpoint in the desired node or debug the associated function module for detailed analysis.
12. Update Debugging and tRFC
Update Debugging
This technique is used to analyze function modules executed with IN UPDATE TASK.
Transactional RFC (tRFC)
Transactional RFCs executed in the background require enabling tRFC debugging settings.
13. ST22 Analysis
Runtime errors are recorded in ST22, which provides detailed short dumps for analysis. Developers can:
- Locate the exact line where the error occurred.
- Access suggested solutions and error descriptions.
Common Runtime Errors:
- COMPUTE_BCD_OVERFLOW: Arithmetic errors due to overflow.
- CX_SY_ZERODIVIDE: Division by zero errors.
- TABLE_ILLEGAL_STATEMENT: Invalid operations on tables.
Image Example:
Conclusion
Mastering debugging techniques in SAP ABAP is vital for efficient program analysis and issue resolution. By using breakpoints, watchpoints, and advanced debugging tools, developers can ensure robust and error-free programs while saving significant time and effort.

