Salesforce Reports (Creating Different Salesforce Reports)
Salesforce reports and Dashboards are used to convert business requirement in to visual representation. In this Salesforce Tutorial training we are going to learn about Creating different Salesforce reports like Tabular Reports, Summary Reports, Joined reports and Matrix reports.
What is a Report in Salesforce ?
A report is a set of records displayed in rows and columns. Reports data can be filtered , grouped and can be displayed through graphical chart types like Tabular reports, Summary reports, matrix reports and Joined reports. Salesforce Report can be Standard report and Custom report.
- Standard reports are pre built by Salesforce.com and stored in Standard folder. This standard reports can not be edited, deleted and Searched.
- Custom reports are the bult by from the scratch and can be stored in unified Public report folder. Custom reports can be edited, deleted and searched.
How to create Salesforce reports custom folder?
To create custom reports folder login Salesforce.com and navigate to Setup | Reports | New report folder.
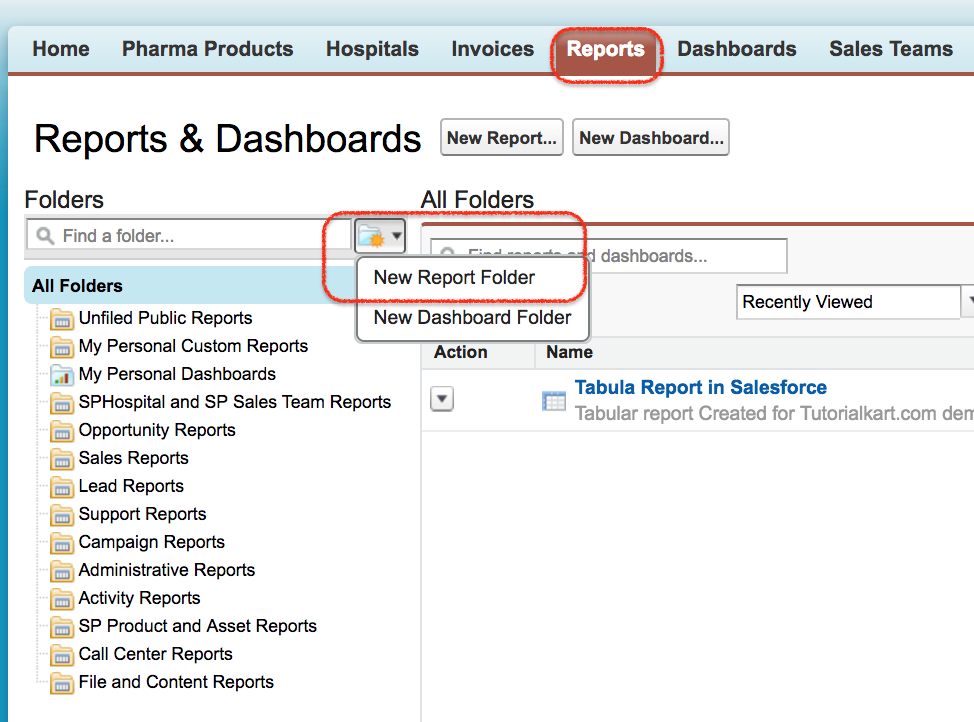
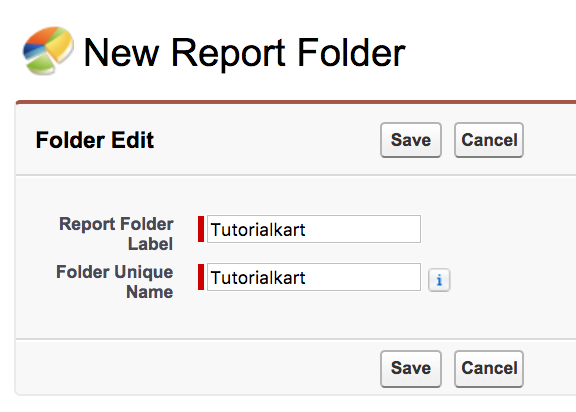
- Enter report folder name and unique name as desires.
- Click on Save button.
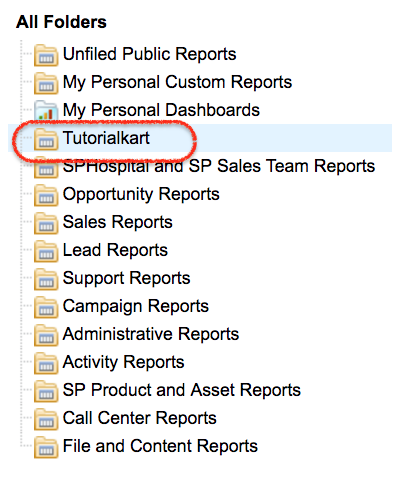
As shown below Tutorialkart report folder has been created successfully. we can move custom Salesforce reports from My Personal custom Reports to Tutorialkart report folder.
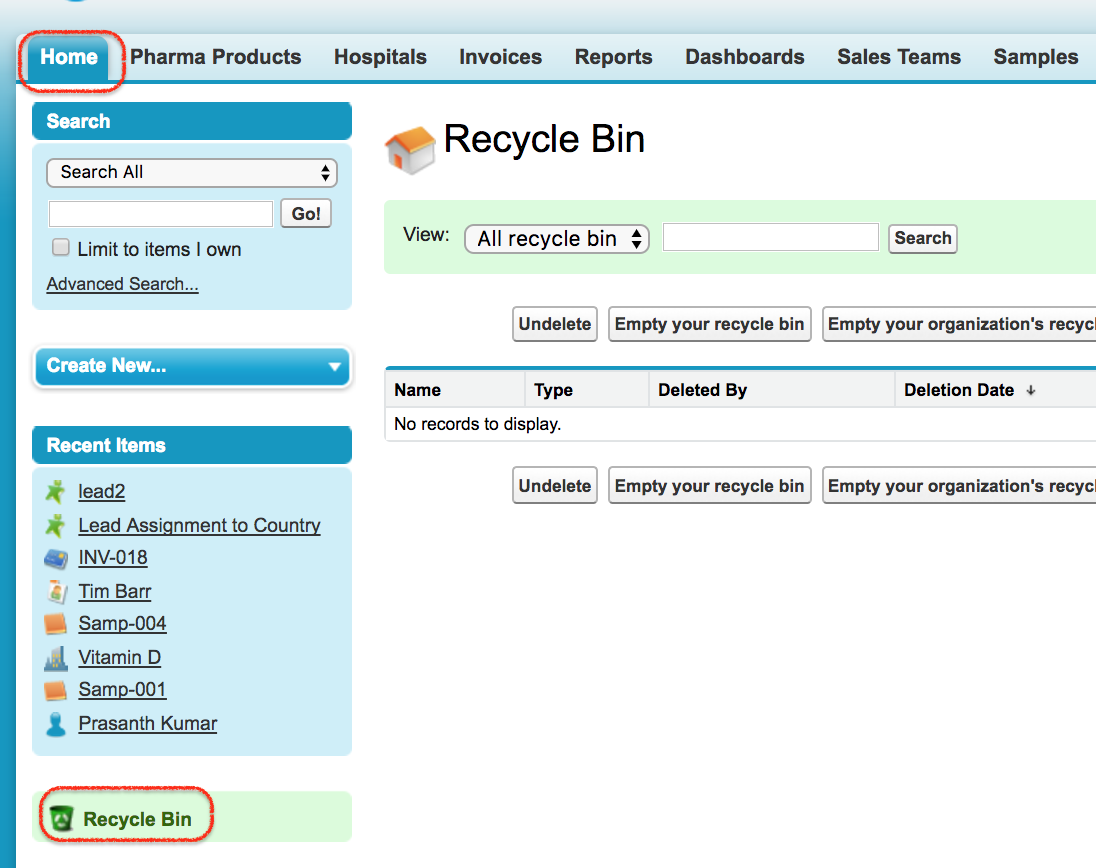
Salesforce reports and Dashboard can be deleted and can be retrieved from Recycle Bin.
Creating different Custom Salesforce reports.
Tabular Reports :- Tabular Reports in Salesforce the most basic, simplest and fastest generates report formats. Here fields are listed in Columns and records are listed in rows. It displays just the row of records in a table like format with grand total. Tabular reports are not used to created Dashboards in Salesforce.
Summary Reports :- Summary Report is the second Salesforce report format which allows users to group rows data which supports sorting and display subtotals.
Matrix Report :- Matrix report is the most complex Salesforce report format where records data is summarized in a grid format. Matrix reports allow records to be grouped by both columns and rows.
Joined Report :- Joined report is the fourth Salesforce Report format where user can create multiple report blocks that provide different views of your data. Here we organize the data in the form of block. Each block is defined as a Sub-report. It can have its own fields, columns, sorting and filtering. A joined report can even contain data from different Salesforce report types.
Salesforce Report Area.
To create Salesforce reports, login to Salesforce.com and navigate to Setup |Reports | New Report | Select report type | Create.
When creating new Salesforce report we can find different Section in report area as shown below.
- Control Area.
- Quick find.
- Data tab.
- Standard Filter Area.
- Report filter area.
- Report data preview area.
- Report Selection.
How to create Tabular report format in Salesforce.
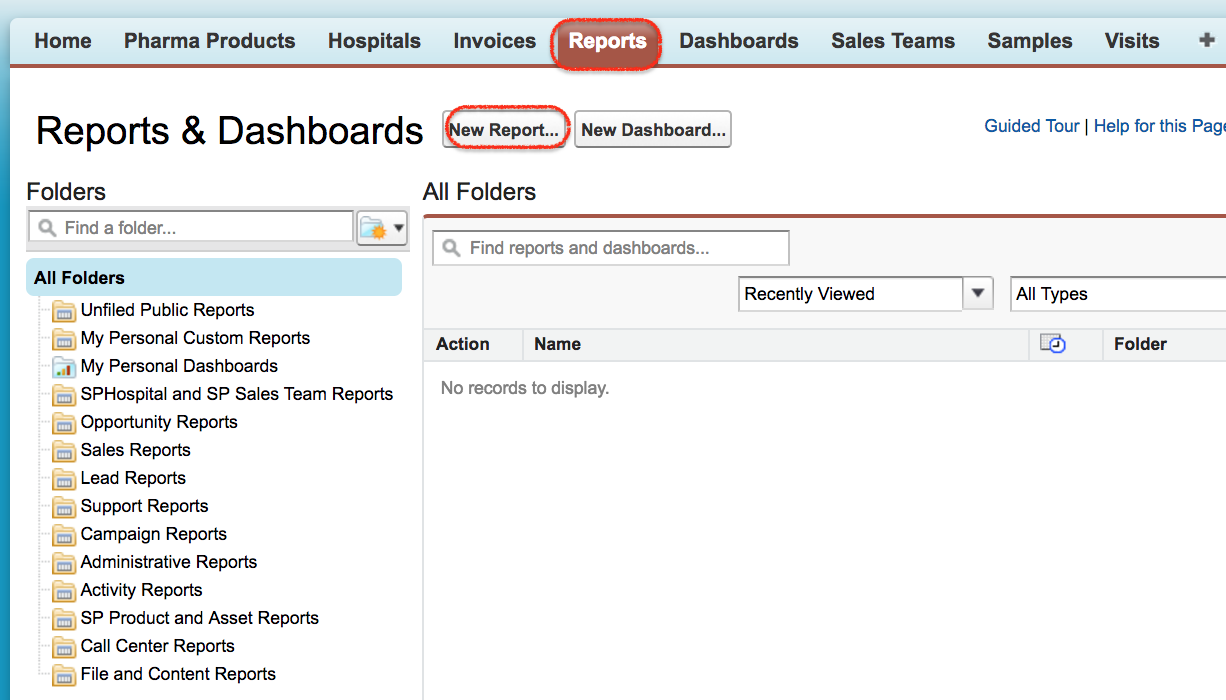
To create Tabular Report in Salesforce, login Salesforce with username and password. Now Navigate to Setup | Reports.
- Now Click on New report as shown above.
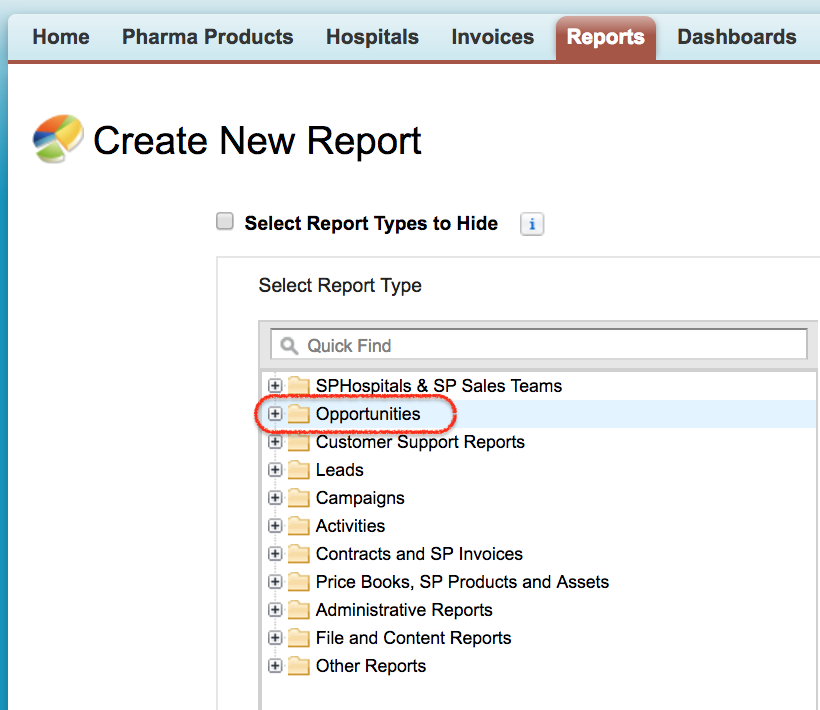
Select the report type that to be created. In this Salesforce tutorial we creating Tabular report for Opportunities.
- Click on Create button.
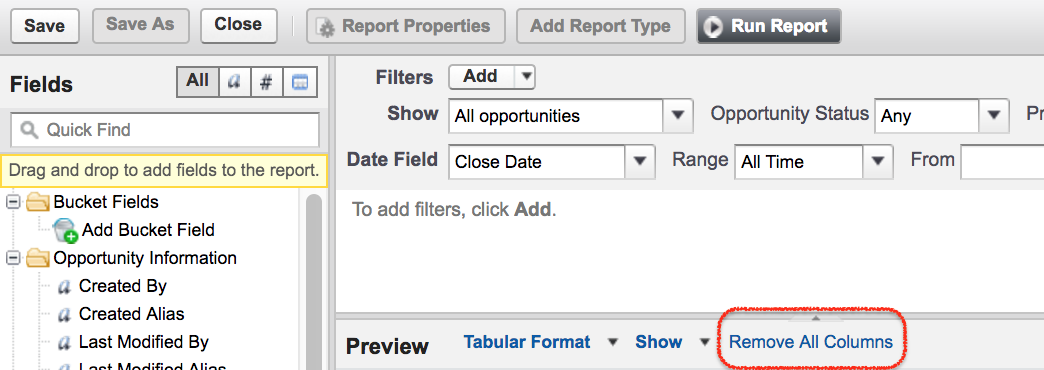
- In Standard filter area, Select show all opportunities and opportunity status as Any, clear date ranges and select range as All time as shown above.
- Click on Remove All columns to clear default columns.
- Now select the fields from the data tab.
- Drag and drop the fields to the columns.
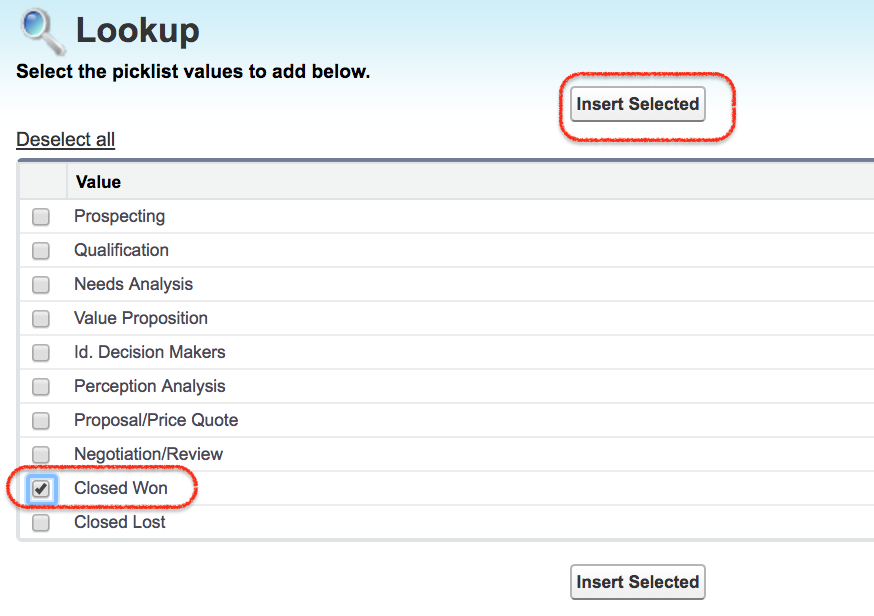
- Now add filter to add opportunites stage closed to own.
- Select Stage equals to Closed own as shown below.
- Select Closed Won and click on insert selected.
- As shown below we have selected four field to the column area.
For Tabular report we have to define row limit. Click on Filter and add row limit. Enter maximum of 99 for limit and click on Ok button. When generating dashboards, Row limit are required for Tabular reports in Salesforce.com. Otherwise no Dashboard is generated with out row limit for tabular reports.
- After adding row limit only a new tab called Dashboard Settings will appear as shown above.
- Click on Dashboard Settings to setup name and value which will be used in dashboards.
- Number and currency fields are only available for Value.
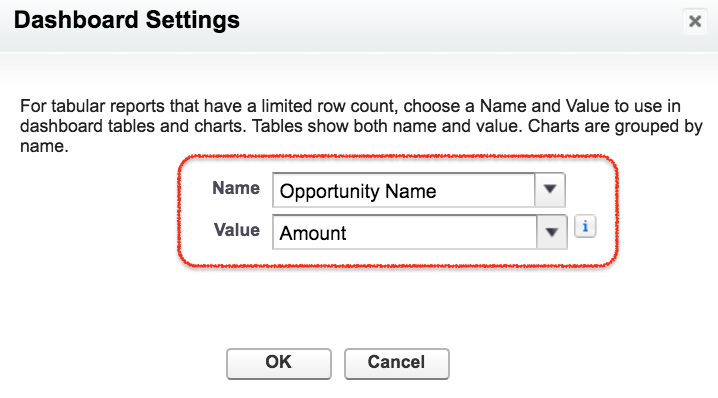
- Enter name as Opportunity Name and value as Amount.
- Click on Ok button.
- Now click on Run report.
- Now all opportunities of type closed own will be displayed in tabular format as shown below.
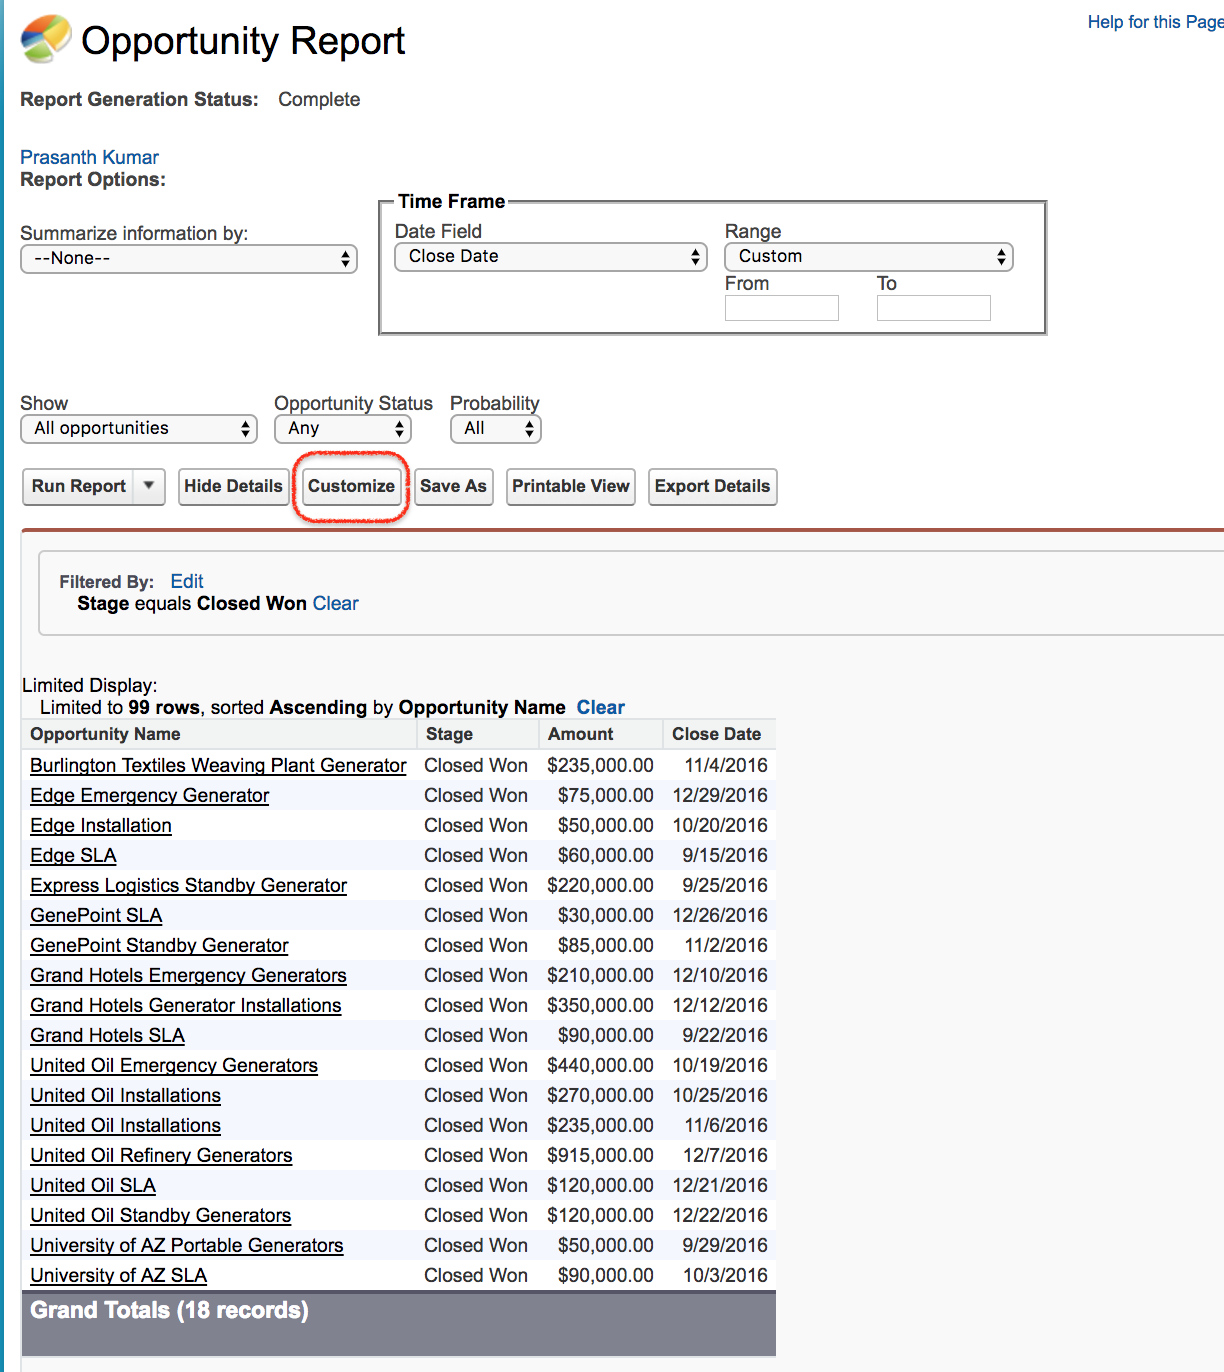
All opportunities are created and displayed in tabular format as per criteria.
- Click on Save as button.
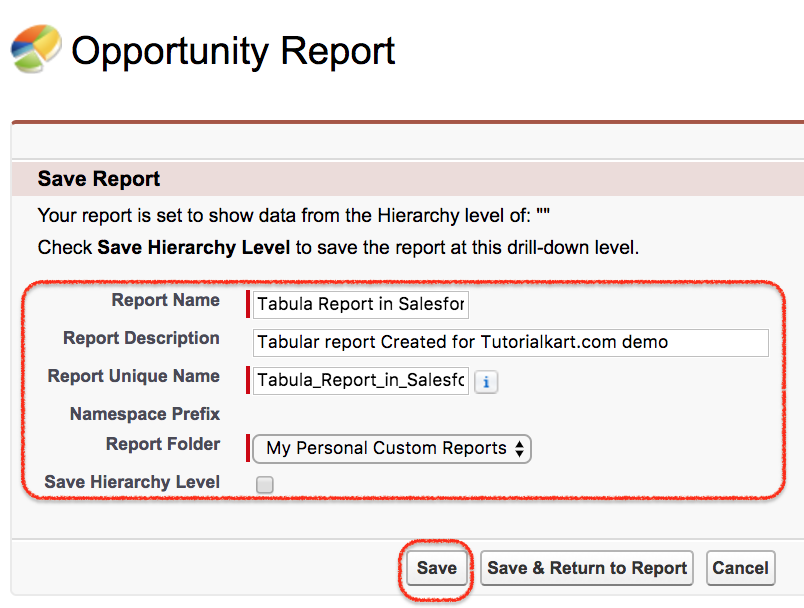
- Enter report name.
- Enter Salesforce Report Description.
- Select Report folder and finally click on Save button.
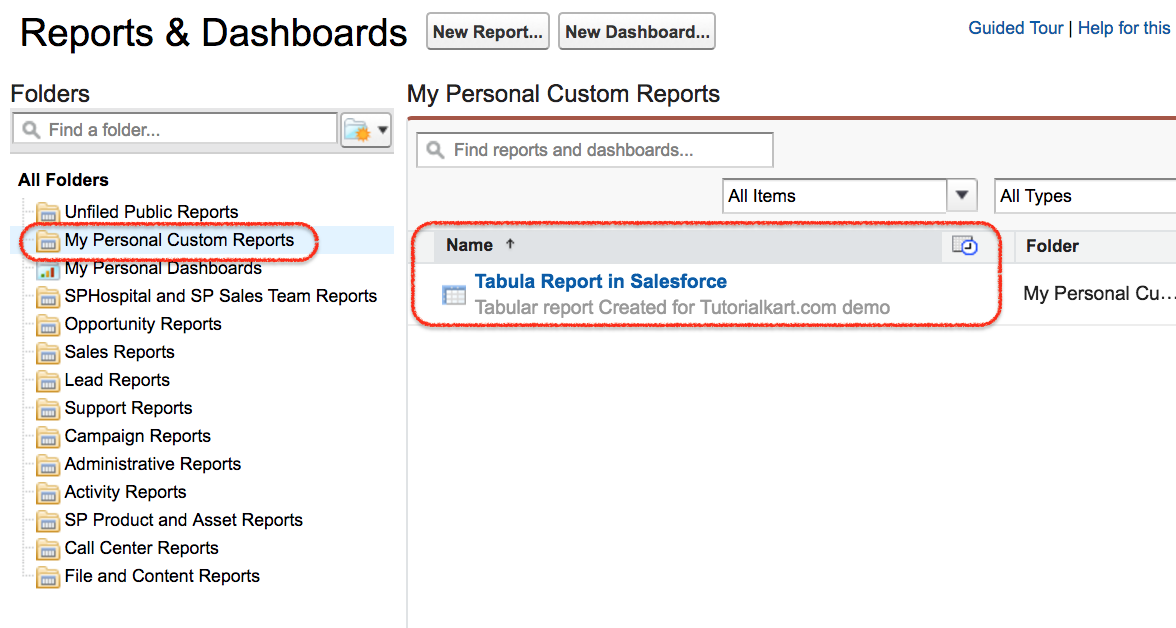
Whenever we access My personal custom report folder we can see our tabular report.
- To customize Salesforce tabular report click on report name.
- Now click on report properties.
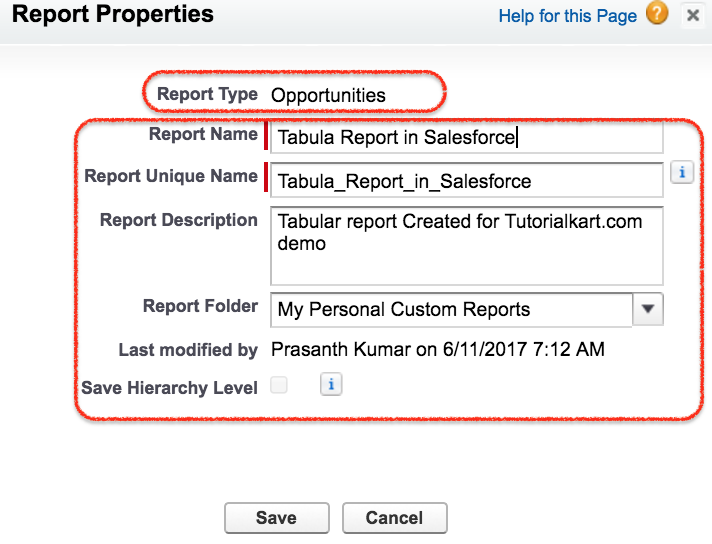
As shown above every details about Salesforce reports like Report Type, Report name, Unique name, description, report folder, last modified by will be available.
- Finally click on Save button.
We have successfully created Tabular report. Like wise we can create other Salesforce Reports like Summary Reports, Matrix reports and Joined Reports.