Summary reports are similar to Tabular Reports but these reports allows grouping of rows data. Rows data can be grouped up to four levels.
- Summary Report is the second Salesforce report format which allows users to group rows data which supports sorting and display subtotals.
- Summary reports displays subtotals based on Value of a field.
Creating Summary reports in Salesforce.com.
Summary reports in Salesforce.com are similar to Tabular reports. To create Summary reports login Salesforce and navigate to Reports | Create new Report.
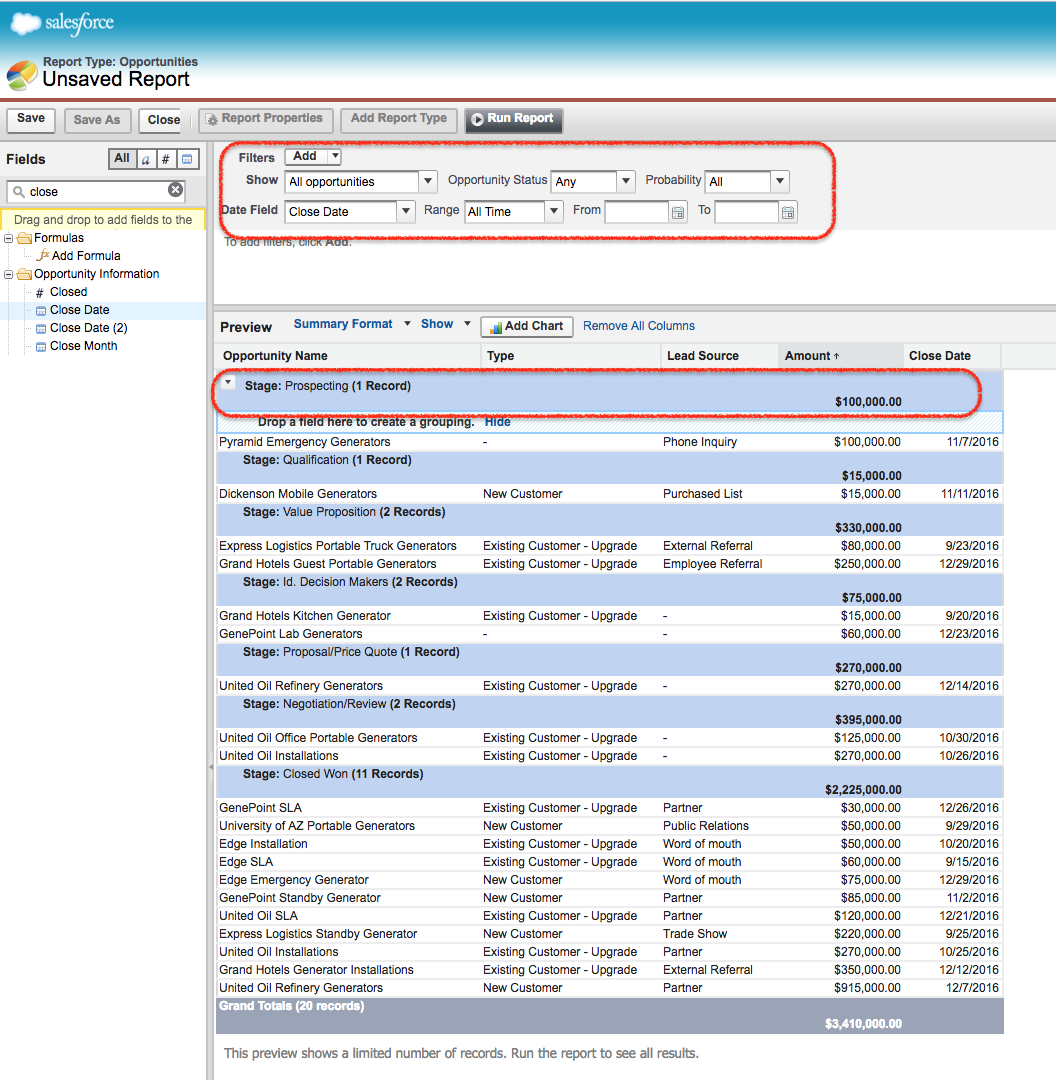
In this Salesforce Training tutorial we are going to create Summary reports for the object Opportunities.
How to add Summary fields to preview pane ?
As shown above we have to add Summary fields to the fields pane follow the steps given below.
- Drag Opportunity Name, Type, Lead Source, Amount, Probability, closed data from field pane to grouping section of the preview pane.
- Wait for the loading dialog to complete.
- Select Summary format.
- In filter section area, select show all opportunities and select range as all time.
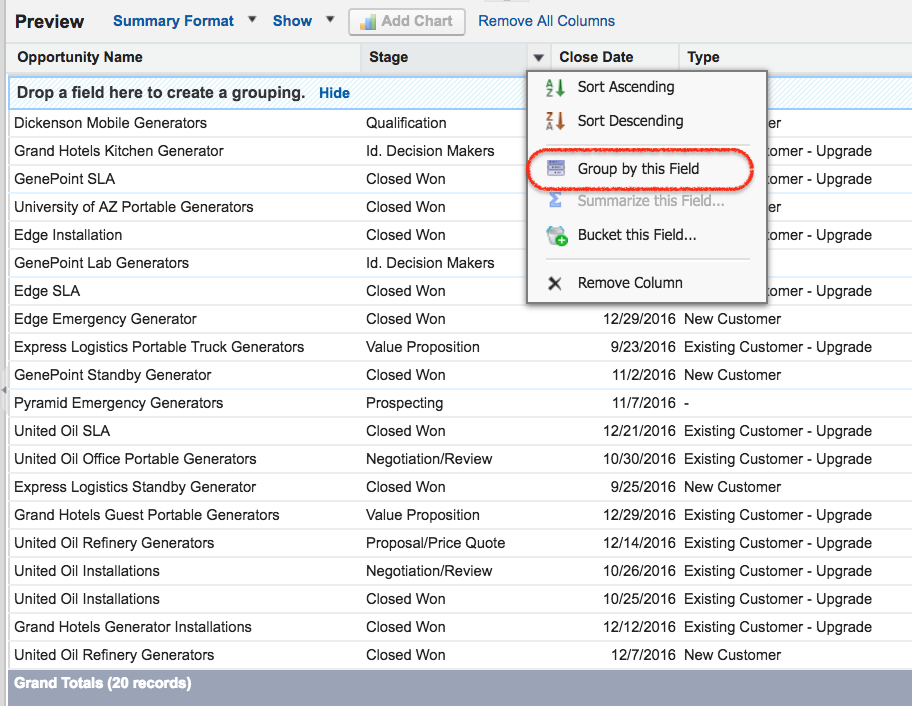
- Now go to Stage field on the column and select Group by this field.
Now the report will appear as shown below.
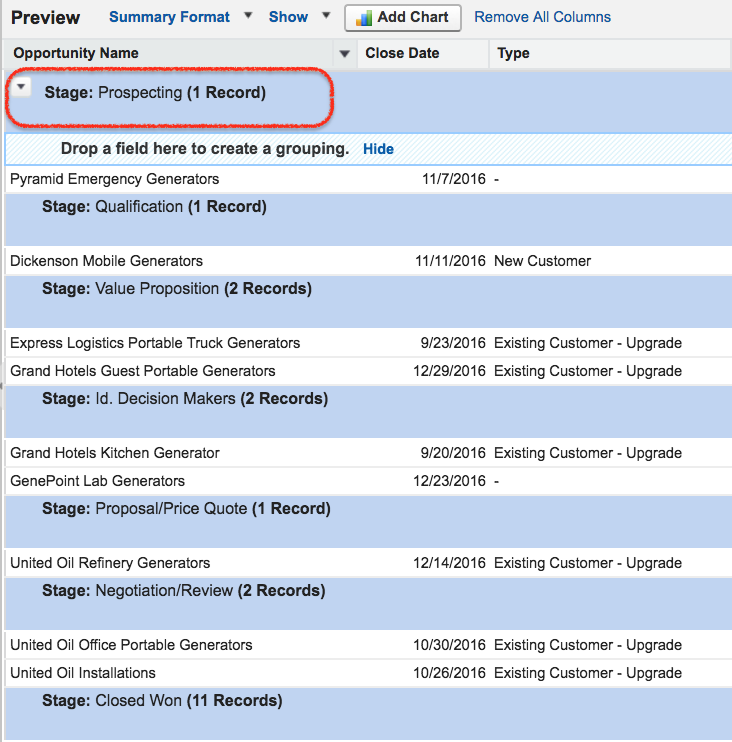
We have grouped rows data based on opportunity Stage. Drag and drop Stage field to group rows data. Salesforce Summary reports can have up to four grouping levels. Summary field is the currency field used to SUM, AVERAGE, MIN or Max for a number and to group levels including grand total levels for reports.
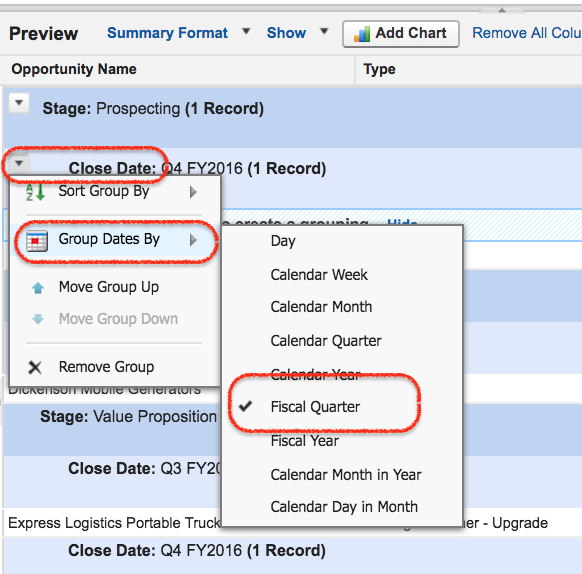
- We have grouped data by another field by Closed data.
How to add summary field to a report?
- To add Summary field in Summary report format, click on column drop down section and choose Summarize this field.
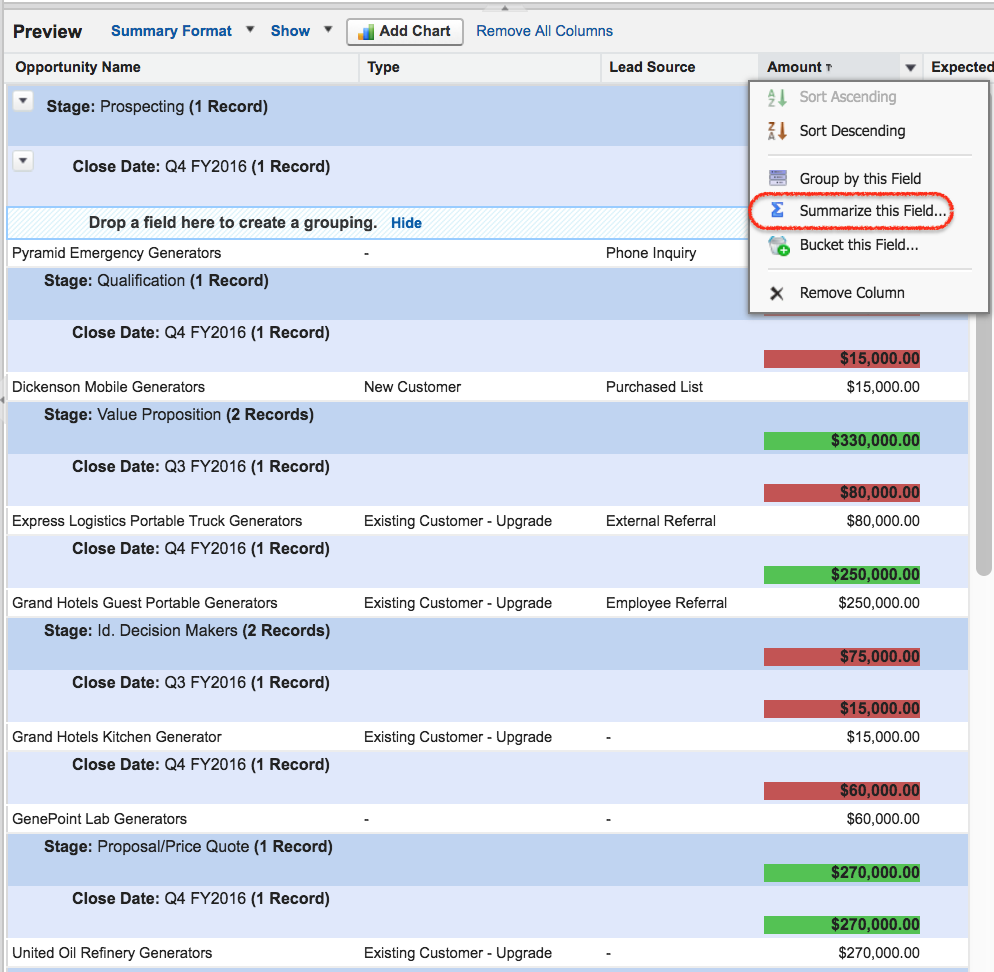
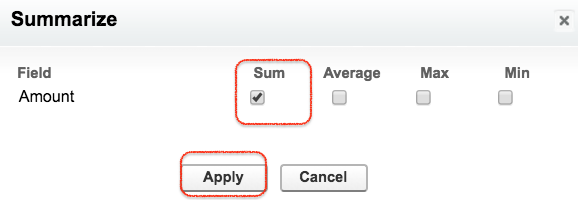
- Now pop up menu will be displayed.
- Select Sum and click on apply button.
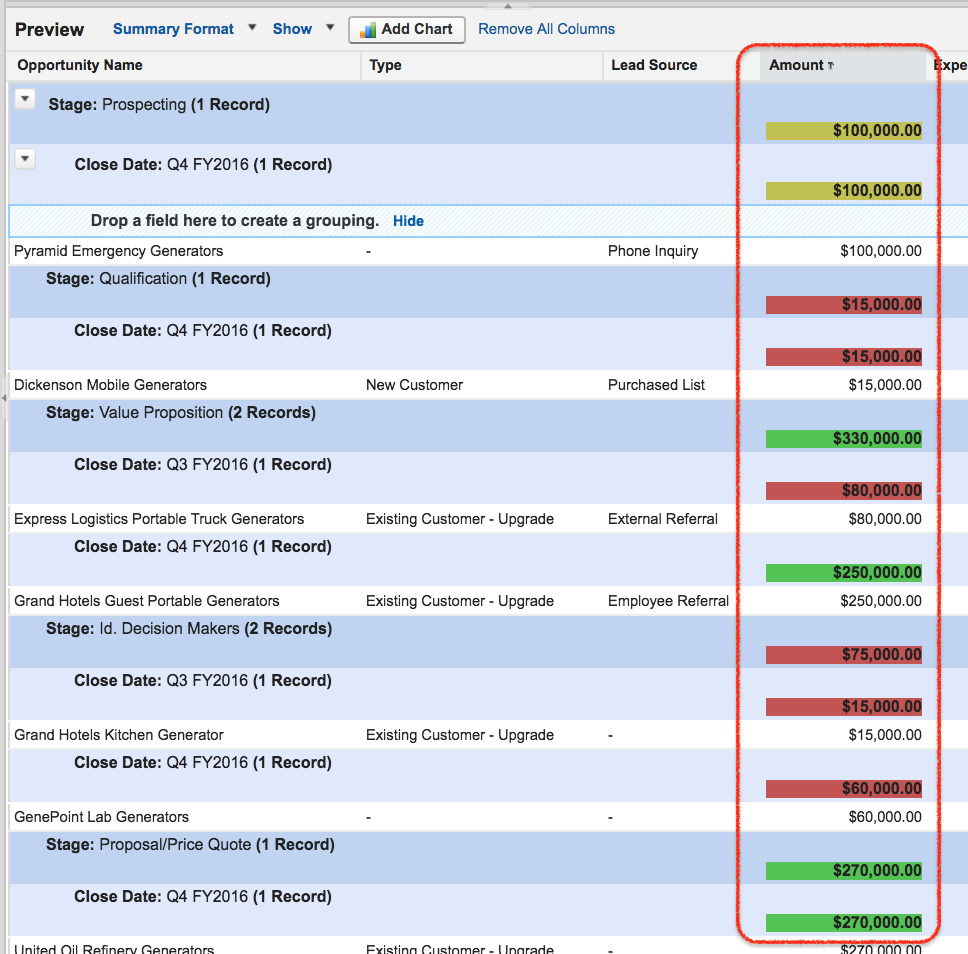
What is Conditional Highlighting in Salesforce reports?
Conditional Highlighting is a powerful way to show values in report within given limits. We can specify colours for different ranges of values in reports using conditional highlighting.
- Click on show drop down and select Conditional Highlighting.
The color to show data for low breakpoint and high break point must be defined as shown below.
- Now click on Run report.
Now above settings will produce a report result as shown.
- To click on Run Report and Summary report will be displayed as given below.
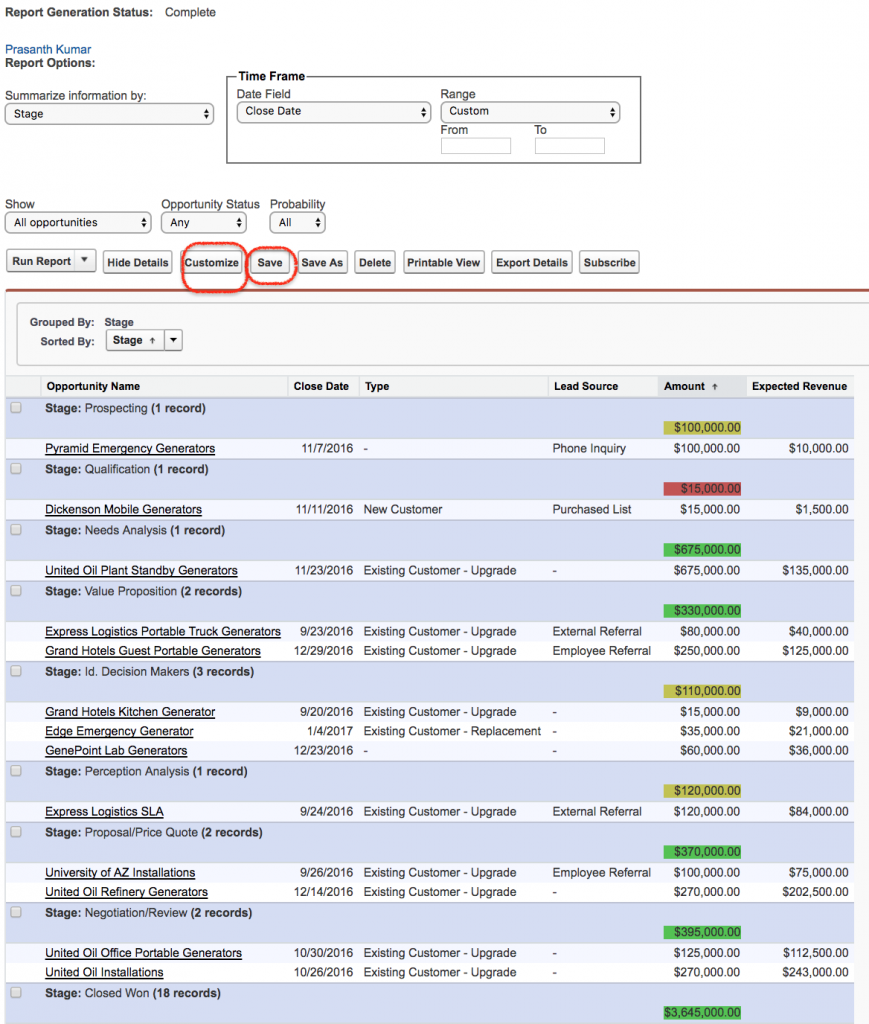
- Finally click on Save button.
- To edit Salesforce report click on customize button.
Conclusion
In this Salesforce tutorial we have learned about creating Summary reports, and Conditional Highlighting in Salesforce reports. In our upcoming Salesforce training we learn about creating Matrix reports in Salesforce.com.